One thing which I love about Pandas – is that, it lets you do things incredibly fast.
Things like slicing & dicing data which will otherwise take a lot of effort & time in excel. It is magic & saves a lot of time.
Let’s look at the problem statement for today:
Count unique values in a data set
So, here are few quick ways to get count of unique values in a data set.
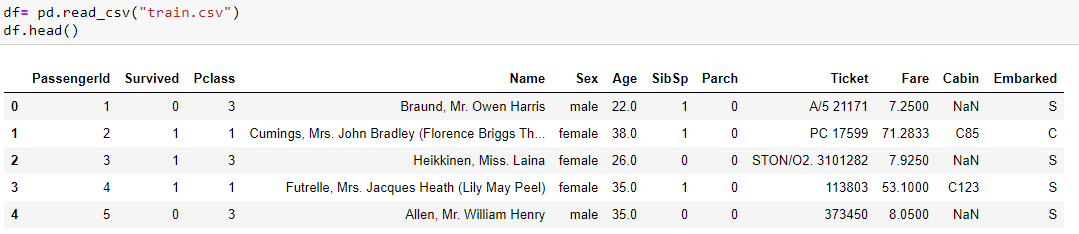
Let’s take an example of the famous Titanic Dataset.
Now, I want to do below things with my dataset:
- Count the different values possible in a column
- Count the frequency of occurrence of each value
Let’s jump straight into the problems.
Question: What are the different columns which we have in the dataset?
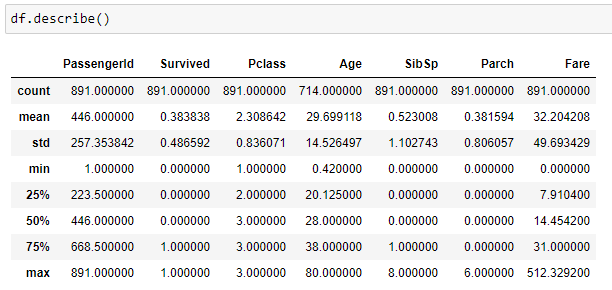
There are a bunch of different methods & attributes of the dataframe to help, these are –
.info(), .describe(), columns, shape.
It is a good idea to start with these.
You can also do a .head(n) or .tail(n) or .sample(n) – to see the records filtered out for you.


Question: What are the different values under a column & what is their occurrence?
df[column selection].value_counts()


Question: How many different unique values are present under a column?
df[column selection].unique()

Though, value_counts() helps us get this;.unique() covers it all and also mentions the missing element as well.
Pandas uses NaN for missing values in the data.
Question: Count the number of unique values present under a column?

Well, if you want to take into consideration the missing values : we need to pass dropna in the nunique method

Question: Can I get the number of unique values present for all columns/entire dataset ?
Yes, we can ! We can pass the axis argument here. zero -> Rows ; one -> columns. That is how axis is defined in pandas. Isn’t this so convenient ?

Question: How many females are in the data set ?
Data subset syntax – df[df.columnname==value] or df[df[columnname]==value]
Well, we know the answer already, but let’s take this for a spin as we learn more about pandas. It is important to learn all these basic methods.
This also introduces to the concept of subsetting of data.
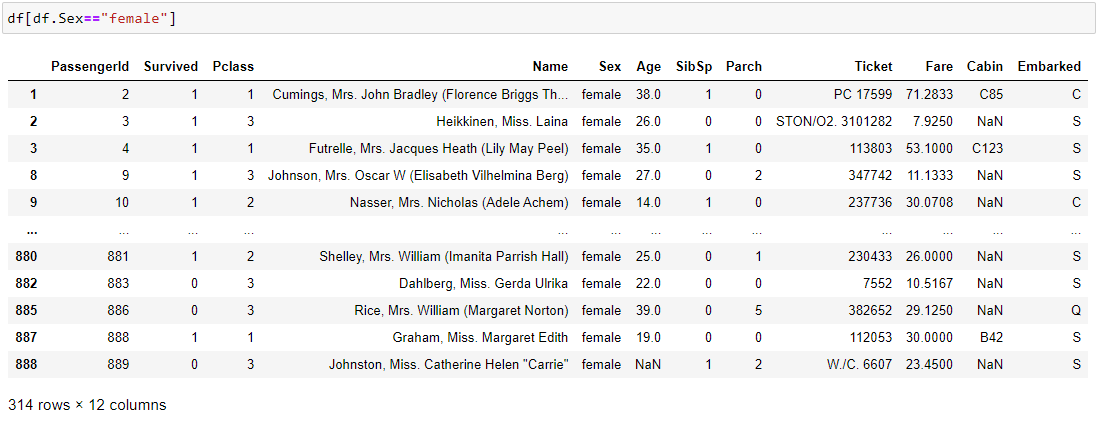
As, you can see: we have subset the data meaning filtered out the data for display based on a value match from the record.
Now, any idea on what we shall do to get the counts here again ? You would have guessed it !

Now, you will argue – since each passenger is represented by the primary key PassengerId – lets just select this column and then do the count on it. You have to be careful here because .count() calculates only non NA/np.nan values. If you have boolean data – then using .sum() wil lead you to the correct number.
In this case , we dont need to worry.

We will cover this in the next post and also talk about using .loc which is a much more obvious way to work with the data.
So, that is all on how we can do count in pandas.